

Prerequisite:-
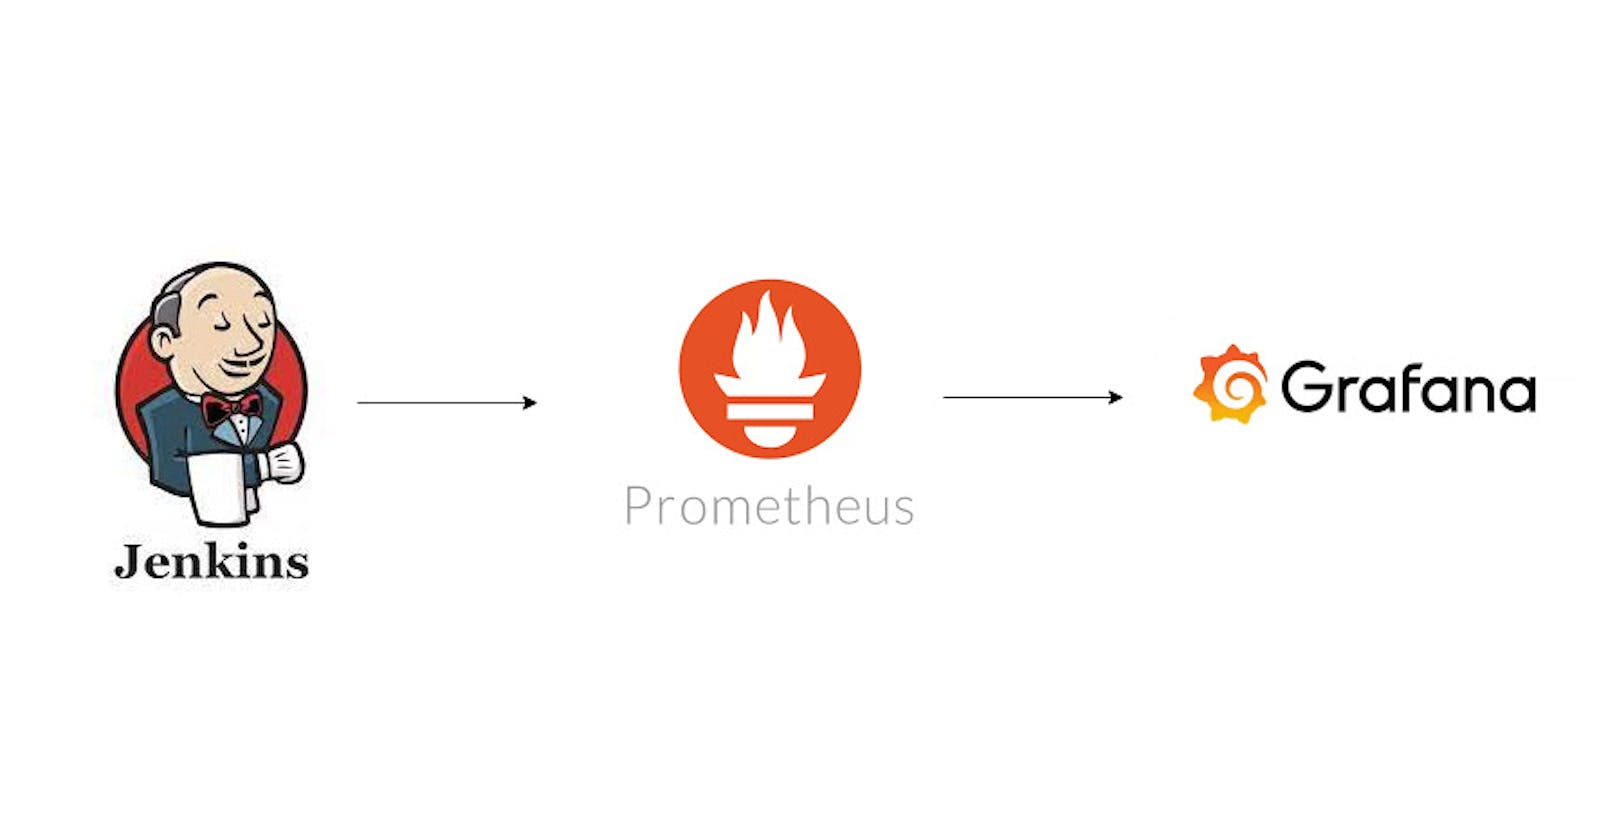
Basic overview of Prometheus & Grafana
A server with Jenkins installed on it
Step 1:- Install Prometheus plugin in Jenkins
We need to install the plugin of Prometheus in Jenkins so that Prometheus can gather all the metrics of Jenkins
In Jenkins click on manage plugin and search for Prometheus metrics plugin and click on install
The default path for Jenkins metrics is <Public-IP:8080/prometheus>
We can also change the default path of Jenkins metrics. Click on Manage Jenkins -> Configure System -> Search for Prometheus and change the path.
Step 2:- Modify the configuration file of Prometheus
Prometheus manages the configuration file named prometheus.yml in which we can define various configuration like alerts, scrape_configs etc.
In order for Prometheus to gather the metrics of the Docker node we need to define below code in prometheus.yml under the scrape_configs stanza
sudo vi /etc/prometheus/prometheus.yml

- job_name: "Jenkins Job"
  scheme: https
  metrics_path: '/prometheus'
  static_configs:
    - targets: ["jenkins.com"]  ##your jenkins URL or IP address x.x.x.x:8080
- After adding the code we can check our node as a target in the Prometheus. It will take some time for Prometheus to gather all the metrics and display the state of node to Up.
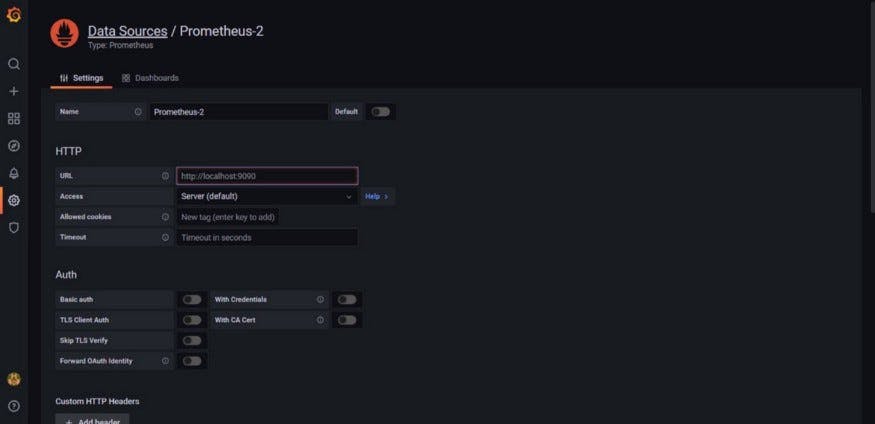
Step 3:- Add data source in Grafana
Now in Grafana we need to add Prometheus as the data source
After that, in the URL section of we need to enter the IP address of the Prometheus server and 9090 port
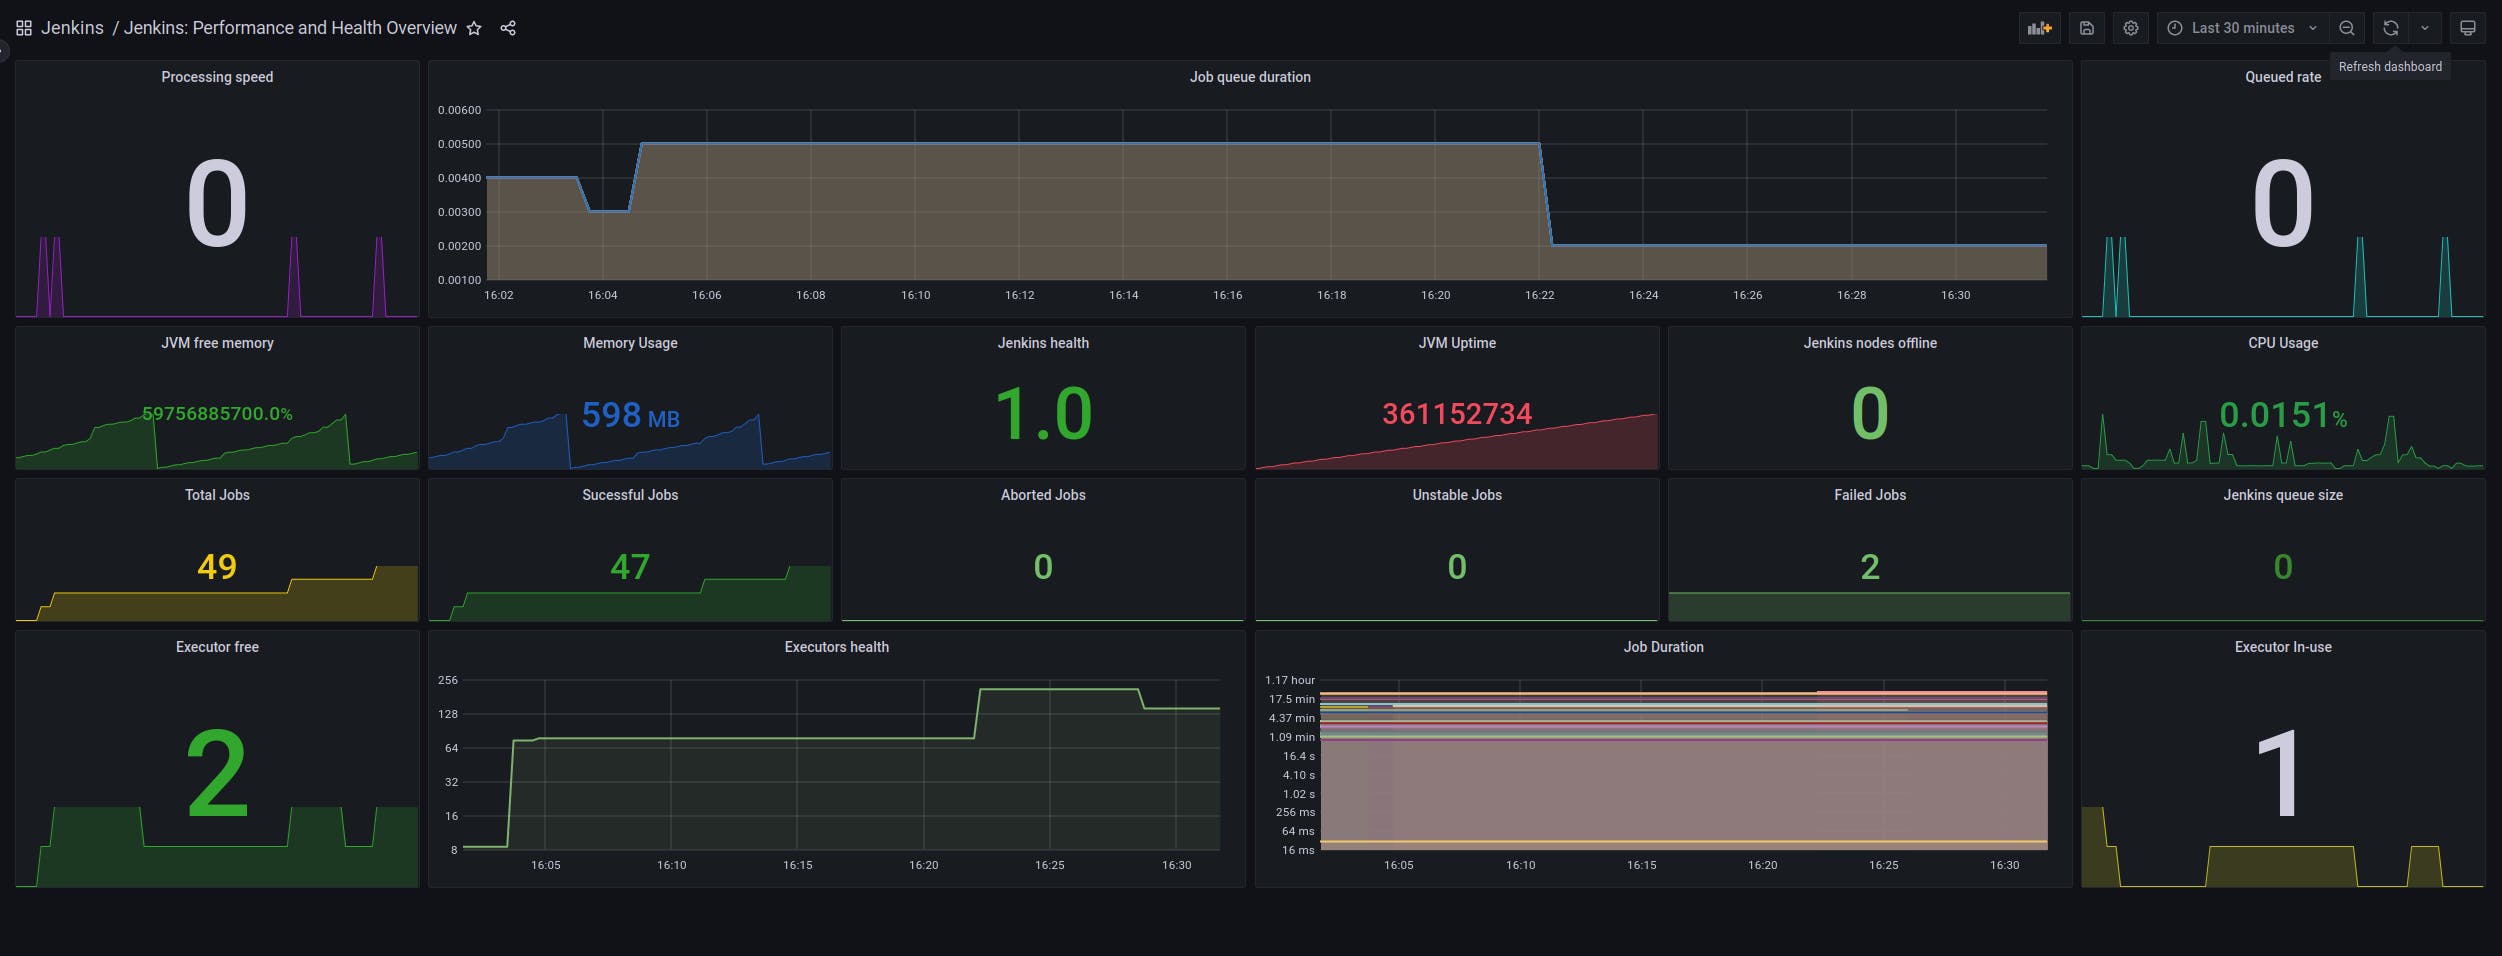
Step 4:- Create a Dashboard
In Grafana we can create various kinds of dashboards as per our need
Import the Dashboard ID is: 9964