How To Install Prometheus and Grafana On EKS Cluster Using Terraform and Helm

An experienced DevOps Engineer understands the integration of operations and development in order to deliver code to customers quickly. Has Cloud and monitoring process experience, as well as DevOps development in Windows, Mac, and Linux systems.
Hey! Welcome to another blog series.
In this edition, you will learn how to install Prometheus and Grafana using Terraform.
There are many ways to install Prometheus and Grafana, but we will use one of the simplest methods, Installing with Helm (a tool that helps you define, install, and upgrade applications running on Kubernetes).
However, if you prefer to install Prometheus manually, click this LINK.
Prerequisites:
A Kubernetes cluster running on AWS, GCP, AZURE, or anywhere.
An Ubuntu machine.
Helm installed.
Terraform installed.
kubectl installed.
AWS CLI installed.
1. PROVIDERS FILE.
In this section, we are going to be creating our providers’ file for us to be able to install Prometheus on our cluster.
In this file, we are calling the already existing cluster with the data module in Terraform.
We will be extracting the cluster’s name and the cluster auth from it to reference them in other parts of our codes.
terraform {
  required_providers {
    helm = {
      source  = "hashicorp/helm"
      version = ">= 2.0.0"
    }

    kubernetes = {
        version = ">= 2.0.0"
        source = "hashicorp/kubernetes"
    }

    kubectl = {
      source = "gavinbunney/kubectl"
      version = "1.14.0"
    }
  }
}


data "aws_eks_cluster" "ClusterName" {
  name = "ClusterName"
}
data "aws_eks_cluster_auth" "ClusterName_auth" {
  name = "ClusterName_auth"
}


provider "aws" {
  region     = "eu-west-2"
}

provider "helm" {
    kubernetes {
      config_path = "~/.kube/config"
    }
}

provider "kubernetes" {
  config_path = "~/.kube/config"
}

provider "kubectl" {
   load_config_file = false
   host                   = data.aws_eks_cluster.ClusterName.endpoint
   cluster_ca_certificate = base64decode(data.aws_eks_cluster.ClusterName.certificate_authority[0].data)
   token                  = data.aws_eks_cluster_auth.ClusterName_auth.token
    config_path = "~/.kube/config"
    }
Also, in the file above, we will define the kubectl, Kubernetes, and Helm providers.
We will also need to specify the location of the Kube config file for the providers listed.
We need to input the name of our cluster into the file, so anywhere you see ‘ClusterName’ replace it with the name of your cluster.
Where you see ClusterName_auth, replace the ‘ClusterName’ part as stated above, leaving the ‘_auth’ part as it is.
In the AWS region section of the file, you should input the region your cluster is running in.
2. INSTALLING PROMETHEUS.
Now that we have set our providers’ blocks, the next step is to create the Terraform script that will install Prometheus.
Before you run this script, ensure that you already have Helm & Kubernetes installed on your system.
data "aws_eks_node_group" "eks-node-group" {
  cluster_name = "hr-dev-eks-demo"
  node_group_name = "hr-dev-eks-ng-public"
}

resource "time_sleep" "wait_for_kubernetes" {

    depends_on = [
        data.aws_eks_cluster.hr-dev-eks-demo
    ]

    create_duration = "20s"
}

resource "kubernetes_namespace" "kube-namespace" {
  depends_on = [data.aws_eks_node_group.eks-node-group, time_sleep.wait_for_kubernetes]
  metadata {

    name = "prometheus"
  }
}

resource "helm_release" "kube-prometheus-stack" {
  name       = "kube-prometheus-stack"
  repository = "https://prometheus-community.github.io/helm-charts"
  chart      = "kube-prometheus-stack"
  version    = "62.5.1"
  namespace  = "monitoring"
  create_namespace = true
  timeout    = 3600

  values = [file("${path.module}/values/prometheus.yaml")]
}
We are defining a data resource block for the node groups created in the cluster we referenced earlier in the providers’ file above.
The other resources we need depend on the creation of the node group.
This step is an important one, especially when you are creating the eks cluster and the Prometheus deployment together or with a pipeline.
We are also provisioning a namespace with the script in the cluster.
Then, we added the link to the Helm repo, the name, and its version in the Helm release path.
We also referenced a ‘values.yaml’ file.
https://github.com/rahulwath/eks_terraform/blob/main/values.yml
After this step, you should have these three files in your directory:

When all the files are ready, you can run the following commands:
$ terraform init
This command helps to initialize terraform.
terraform apply --auto-approve
This command runs your terraform script.
After the script has executed successfully, use this command to see the current namespaces:
$ kubectl get namespace
And to see the services in the Prometheus namespace, use the following command.
You should also see the Grafana service in the output.
$ kubectl get svc -n monitoring
output

NAME                                      TYPE        CLUSTER-IP       EXTERNAL-IP   PORT(S)                      AGE
alertmanager-operated                     ClusterIP   None             <none>        9093/TCP,9094/TCP,9094/UDP   15m
prometheus-grafana                        ClusterIP   172.20.128.125   <none>        80/TCP                       15m
prometheus-kube-prometheus-alertmanager   ClusterIP   172.20.45.181    <none>        9093/TCP                     15m
prometheus-kube-prometheus-operator       ClusterIP   172.20.128.175   <none>        443/TCP                      15m
prometheus-kube-prometheus-prometheus     ClusterIP   172.20.79.122    <none>        9090/TCP                     15m
prometheus-kube-state-metrics             ClusterIP   172.20.122.220   <none>        8080/TCP                     15m
prometheus-operated
4. ACCESSING GRAFANA & PROMETHEUS ON THE WEB
After you have installed Grafana and Prometheus with the Terraform script, you will need access to it, right?
There are a few ways to access your Grafana and Prometheus on the web.
When you put that IP address or DNS name in the browser you should get this:

The username is admin, and the password is prom-operator.
And when you are in, this is how the interface should look:
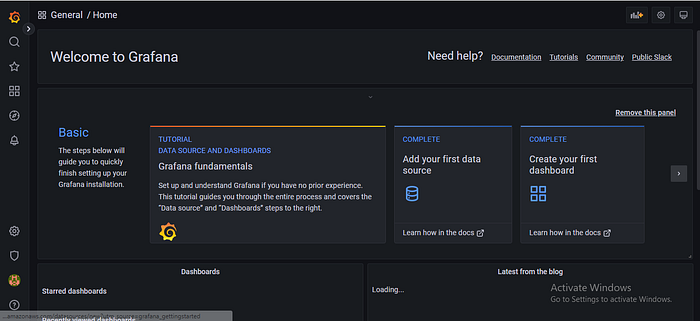
Copy the Prometheus DNS name or IP address and put it in the browser and also open port 9090:
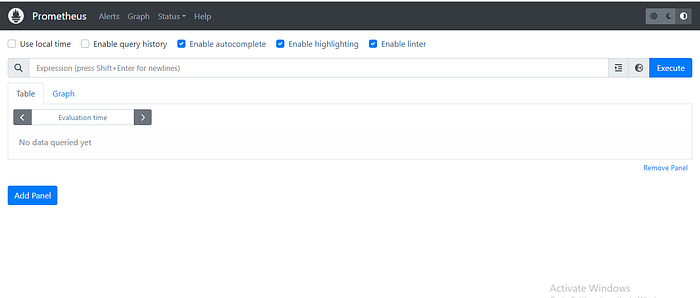
And with these steps, you have installed both Prometheus and Grafana on your cluster with access to their U.I.
Congratulations! See you in the next series!


